Node Interactive 2015 Recap
Node Interactive 2015 is the Node.js Foundation lead conference.
There are three major tracks of breakout sessions: Server-Side Client-Side Internet of Things
Here are several topics excerpt from mainly the backend track.
Node.js Ecosystem
As of Dec. 2015, there are more than 200,000 Node.js modules exist in NPM, namely, the Node, Package, Manager.
NPM is the largest package manager in the world
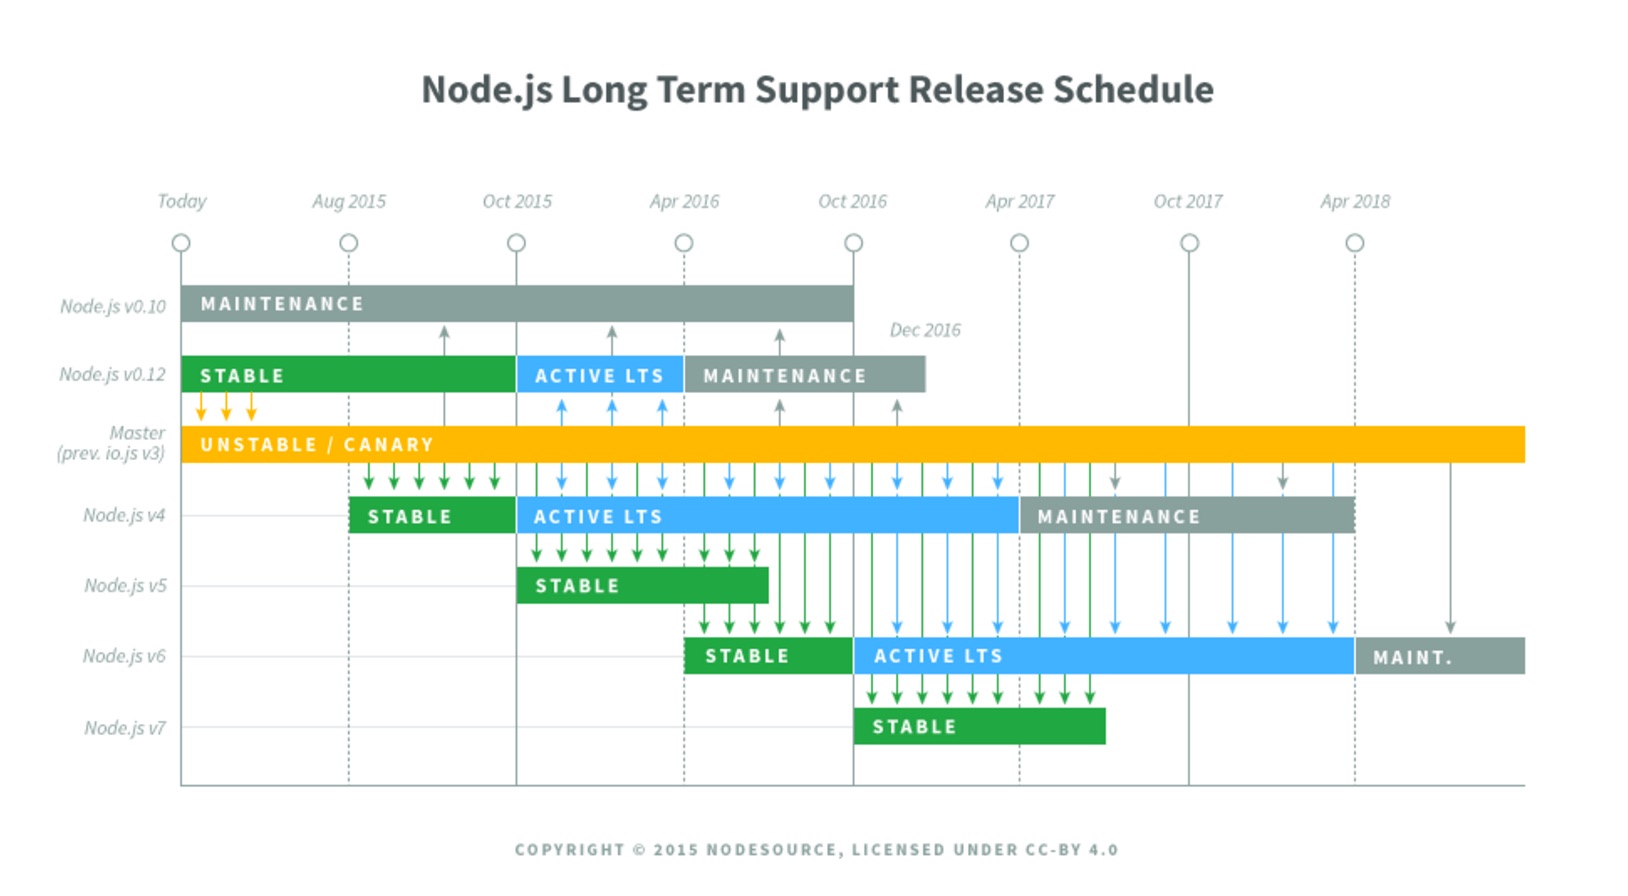
After the merge with io.js, the Node release version seems skyrocketed. Luckily, the good thing is Node.js has come up with the LTS version, thus making enterprise adopters more comfortable with this still new technology. While at the same time, it keeps the speed for development and evolving.
Node.js Long Term Support Schedule (as of Dec. 2015)

The Adoption Trend
With Node.js being used in 98% of the Fortune 500 companies regularly, the event will also highlight the maturation of the technology within enterprises.
Capital One, GoDaddy, Intel, NodeSource, NPM and Uber are using Node.js to meet their innovation needs
Startups are leading the way in adding Node.js into their strategy, but in 2013 and 2014 larger incumbents started to transition their stacks with Node.js as a core technology, notable names include PayPal, Condé Nast, and Costa.
Node.js in Production
As the the Node.js technology develops, more and more Big companies put Node.js into production.
Here are some notable examples (as of Dec. 2015):
Paypal: Node.js replaces Java/Spring 2012
Uber: Early adopter, Realtime API, open source: ringpop, tchannel
Netflix: Node.js, restify, React, Docker, AWS EC2 Container
IBM: Top use cases for Node are REST APIs and real time services.
Intel: IoTivity, leader in Internet of Things
Debugging Node.js in Production
Presentation by Yunong Xiao @ Netflix Node Platform
Here are 3 issues in production and their corresponding solution:
- Runtime Performance
- CPU profiling/flame graphs
- Runtime Crashes
- Inspect program state with core dumps
- Memory Leaks
- Analyze objects and references with core dumps
Making Your Node.js Applications Debuggable
Presentation by Patrick Mueller @ NodeSource
Intro
Profiling Node.js mainly referring to performance(CPU) and memory.
- Node Profiling:
- Performance with V8 CPU profiler
- Memory with V8 heap snapshots
Performance
- Understanding performance
- Self time - time to run the function, not including other function calls.
- Total time - time to run the function, including other function calls.
- How to get CPU profiles?
- npm v8-profiler (requires instrumenting your code)
- npm node-inspector
- StrongLoop Arc
- NodeSource N Solid
Memory
- What are v8 heap snapshots?
- JSON file describing every reachable Javascript object in the application, taking snapshots always starts with a garbage collection
- JSON files are … large
- Understanding heap snapshots
- Shallow Size: The memory allocated to store the object itself
- Retained Size: The size of memory that can be freed once an object deleted
Summary
- Profiling performance
- look for width for trace visualization
- scripts: start profile, run load tester, stop profile
- use node/v8 option —no-use-inlining to turn off function inlining
- Profiling memory
- Easiest way to detect memory leak take memory snapshot
- ‘Tag’ objects you think might be leaking with easy to find class
Node.js Performance Optimization
Presentation by Bryce Baril @ NodeSource
Purpose of performance optimization: Task Completion (User experience) & Throughput (Scale)
Proposed workflow for performance optimization:
📝 WORKFLOW 📝
- ❔ Is it fast enough?
- 🔍 Identify the nature of the problem. (🏗 vs 🏭)
- 🔬 Select tools based on the problem.
- 📐 Measure.
- 📍 Identify the location of the problem.
- 👓 Make the slower parts faster.
- 📐 Measure again.
- 🔁 Go back to step 0.
💩 REASONS FOR POOR PERFORMANCE 💩
- Wrong tool for the job;
- Doing unnecessary things;
- Poor algorithm choice;
Useful Resources
If you liked this post, you can share it with your followers or follow me on Twitter!